Data Fusion
Bringing together key variables from disparate sets of information, we can fuse multiple data sets to get to the core of the problem and its solution.
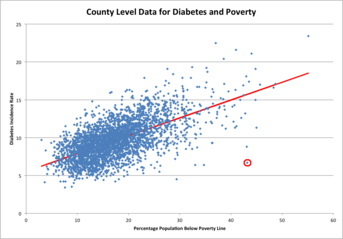
We combined county-level statistics from the CDC for the rate of diabetes incidence in the country with county-level statistics on the poverty rate from the Census Bureau. We found that there was a correlation (0.63) between how common diabetes was in a county and what percentage of the population lived below the poverty line. The best fit line shows that this correlation is of moderate strength. The biggest outlier is circled in red. Here we see a county that has a diabetes incidence rate much lower than the simple model would predict. The poverty rate is over 40%, but only 6 out of 1000 residents have diabetes. A quick visit to the Wikipedia page for Crowley County offers an explanation. Approximately one-third of the population are "residents" of the prison. They all count as below the poverty line. They are counted for census purposes, but health issues are likely not reported through the county health organization. If you reduce the poverty rate for this county by 30%, you see that the diabetes rate is much closer to what would be predicted for a county with only 10% poverty.